Your Guide to Moomoo Free Stock
This page may contain links from our sponsors. Here’s how we make money.
Moomoo is a stock trading app. It’s popular because it’s commission-free and it periodically offers good free stock promotions. In this article, we will take a closer look at Moomoo and the latest stock promotion offer in more detail.
The Moomoo Basics
Moomoo Financial Inc. has been in operation in the U.S. market since 2018 and it’s become a popular trading platform to trade stocks, ETFs, options, and more with low fees. The trading platform is a subsidiary of Futu Holding Limited. This company is listed on the Nasdaq with the FUTU ticker and it’s regulated by the SEC and FINRA, which provides investor protection up to $500k via the Securities Investor Protection Corporation (SIPC).
 Get Up to 15 Free Stocks +Tesla/Google and $50 cash coupon from Moomoo!
Moomoo is a commission-free stock trading platform with a user-friendly app and professional-grade tools, including a powerful stock screener and advanced charting tools. For a limited time, you can get up to 15 free stocks plus an extra share of $TSLA or $GOOG and a $50 cash coupon!
- Commission-free trades of stocks, ETFs, options, and ADRs
- Powerful screening and charting tools
- Free real-time level 2 data
- User-friendly mobile app
- AI monitoring
- AI-powered price forecasts
Many free trading apps and platforms focus on U.S. securities and crypto trading. But, Moomoo has low-cost trading technology to give its users access to emerging markets too. Trades can be made on the Hong Kong, Chinese, and U.S. markets, which opens up a number of exciting trading opportunities. This is especially true if you want to trade outside the U.S. with a reputable trading platform.
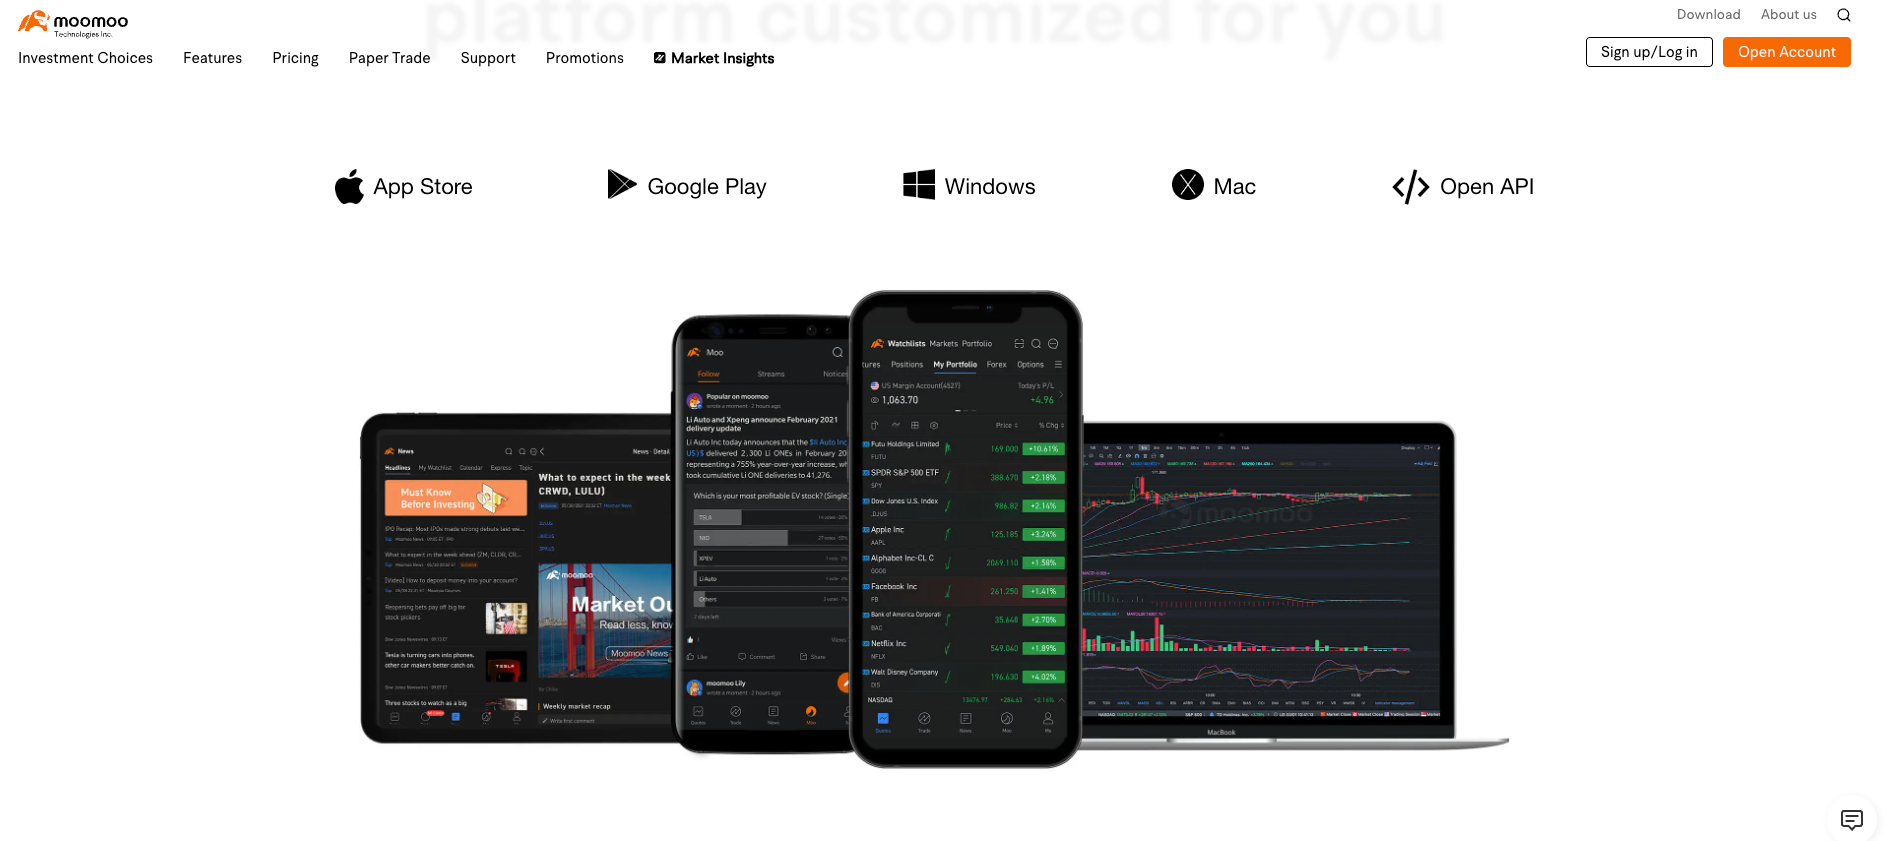
Moomoo is available as a mobile app and online interface to make free trades. Traders have access to advanced trading tools and a customizable platform. The app can be used with your favorite Android or iOS mobile device or you can use the PC or Mac desktop version. The interface is clean and functional, it’s easy to sync alerts, notifications, and your preferred setups across every one of your devices.
Moomoo Free Stock Overview
If you’re interested in this current promotion, you need to act quickly because it runs until 8/31/23. Moomoo is offering up to 15 free stocks, but there are three stages that you need to complete to claim them and get the most out of this promotion:
Create a Moomoo Account
You will need to sign up for a Moomoo account and then deposit $100. When this step is complete, you can earn 5 free stocks that are valued between $3 and $2,000.
A net deposit of $100 is required during the promotion period, which will give you five opportunities to draw a free stock worth between $2 and $2,000.
When your free stocks are drawn, you must maintain an average asset balance of $100 or more for the next 60 days. The assets can include cash and securities positions and when these requirements are met the free stocks are unlocked.
Deposit an Additional $1,000
This is the next reward tier, deposit an additional $1,000 in your Moomoo brokerage account. This will give you the opportunity to earn 10 extra free stocks that could be valued from $2 up to $2,000 each.
After the free stocks are drawn, you need to maintain an average asset balance of $1,000 for 60 days or more. After these requirements are met, the stocks are unlocked.
Deposit an Additional $5,000
This is the final promotion reward tier. To qualify, you need to deposit an additional $5,000 into your new Moomoo brokerage account within the promotion period. When this step is complete, you will earn 15 free stocks valued between $3 and $2,000, plus a free stock of Tesla or Expedia and $100 cash in your account.
The average asset balance of $5,000 or more must be maintained for 60 days or longer to unlock these free stocks.
The Promotion Fine Print

There are seven things to bear in mind. They are:
The offer is available for clients that have not deposited before this promotion started.
The deposits must be made within the aforementioned promotional period. Because transfers can take time to process, it’s important to sign up before the offer expires. This will ensure that the deposit arrives before the deadline.
The deposit bonus is only available to U.S. residents who are 18 years or older with a valid Social Security Number (SSN).
The new Moomoo account holder can not have made a deposit before this promotion started.
The bonus must be redeemed manually. The free shares are not automatically added to your Moomoo account. Go to the “Welcome Bonus” section of the app or desktop version and hit “Draw.” You will receive a push notification to remind you that you need to claim your shares if you forget.
Lump sum deposits are not a requirement. You can hit the average account balance of $100 or $2,000 to get the extra shares for 60 days after the day you received your first free stock.
Every mobile or computer device can only be applied to one account and deposit bonus. Any other accounts on the device are not able to receive these rewards.
How to Open a Moomoo Account
There are four easy steps to open your new Moomoo account and begin trading:
1. Open the Moomoo App
To start, open the Moomoo app to register and then simply tap on the “Get Started” button to open your new account.
2. Add Some Basic Information
All U.S. residents need to input a valid address, their social security number, and an email address or a mobile phone number. A text message will be sent to your phone with a code that you need to enter on the Moomoo website.
To open the account, visit the Moomoo promo page and click the link to open an account and sign up. The phone number, email address, and password can be entered and the on-screen prompts will guide you through the entire process. When every detail has been filled in correctly, submit the digital application and move on to the next step.
3. Confirmation
Now, it’s time to confirm the financial information you supplied and acknowledge the risk disclosure to finish. Most new Moomoo accounts are confirmed on the same day, but in some cases, it can take 1-3 business days. Once your account is approved, you will be informed and you can set up the account to start trading.
4. Funding the Account
The Moomoo account is now open, but you’ll need to deposit some funds to start trading. The Moomoo software makes it easy to make deposits.
Simply pull up the ACH/wire transfer widget in the app, tap the “Accounts” button at the bottom, and select “Deposit” on the next page.
There are two choices; ACH or wire and both can be used to transfer cash into your Moomoo account. If you prefer to link a savings or checking account, you can connect it now and then make an ACH or wire transfer. The on-screen prompts will guide you through the entire process.
FAQs
When Can I Expect to Receive the Free Stock?
After a successful draw and the receipt of your free stock, you will have a “Pending” stock added to your Moomoo account within five business days.
After you receive the “Pending” stock, you will need to ensure that your average asset balance remains at $100 or more for at least 60 days to unlock the “$100 Deposit Bonus” stock.
To unlock the “$1,000 Deposit Bonus” stock, the account must have an average asset balance of $1,000 or more for 60 days or longer.
If the asset balance is maintained at $5,000 or for 60 days to unlock the “5,000 Deposit Bonus” stock.
The free stock is available for trade after it has been added to your account. If you didn’t get the free stock within five business days after drawing, contact the customer service staff.
How Do I Claim the Free Stock Rewards?
When you have met the promotion criteria, you will receive an in-app notification. Navigate to the “Welcome Bonus” page in the Moomoo app, tap “Draw” and you can claim your rewards.
If you have more than one opportunity, simply tap “Draw” until they are used up. The Moomoo free stock is added to your account within five business days as “Pending” or “Frozen.” At any time, you can check the stock on the “Brokerage Account” page at the bottom when you tap the “Trade” button.
Many companies only offer this in the US, but Moomoo offers their sign-up bonus to the US, Canada, Australia, and Singapore!
What is the Moomoo Ambassador Program?
This is available to all Moomoo account holders. It’s a referral program that allows you to earn cash rewards when you bring new people to this trading platform.
Your unique referral link can earn you $100 for each new Moomoo user who opens an account and deposits $100 or more. When a referred user deposits $5,000 or more, this cash reward bonus is $200.
What are the Moomoo Fees?
There are no account or withdrawal fees.
Summary
Moomoo may be a relatively new trading platform, but it has garnered a good reputation and has the backing of a solid company. If you’ve been searching for a brokerage app that has a feature set similar to those found on advanced desktop trading apps, this may be what you’ve been looking for.
It’s also good to know that Moomoo offers one of the best free stock offers on a fairly consistent basis. To take advantage of this Moomoo free stock promotion, it’s important to act quickly to ensure that the funds are in place before the deadline arrives.
Investment Platforms

|
|

|
|
Features:
|
Features:
|
Features:
|
- Commission-free trades of stocks and ETFs
- Buy and sell 25+ different cryptocurrencies
- Fractional shares
- Access alternative investments
- High-yield treasuries accounts
- Social community of investors
- User-friendly interface
- Commission-free trades of stocks, ETFs, options, and ADRs
- Powerful screening and charting tools
- Free real-time level 2 data
- User-friendly mobile app
- AI monitoring
- AI-powered price forecasts
- Free investing courses
- Commission-free trades of stocks, ETFs, options, and cryptocurrency
- Buy fractional shares for any amount
- Extended trading hours
- Advanced reporting tools
- Schedule recurring investments
- IRAs now available
- 24/7 customer service